---
title: ggplot2一页多图(图独立)
date: '2018-07-15'
categories: r
---
```{r setup, include=FALSE}
knitr::opts_chunk$set(message = F,warning = F,comment = "#>",collapse = TRUE)
```
在一个页面上自由组合各种图(可以毫无关联),省空间,又能表达自己需求。
```{r}
require(ggplot2)
require(grid)
#####现将图画好,并且赋值变量,储存#####
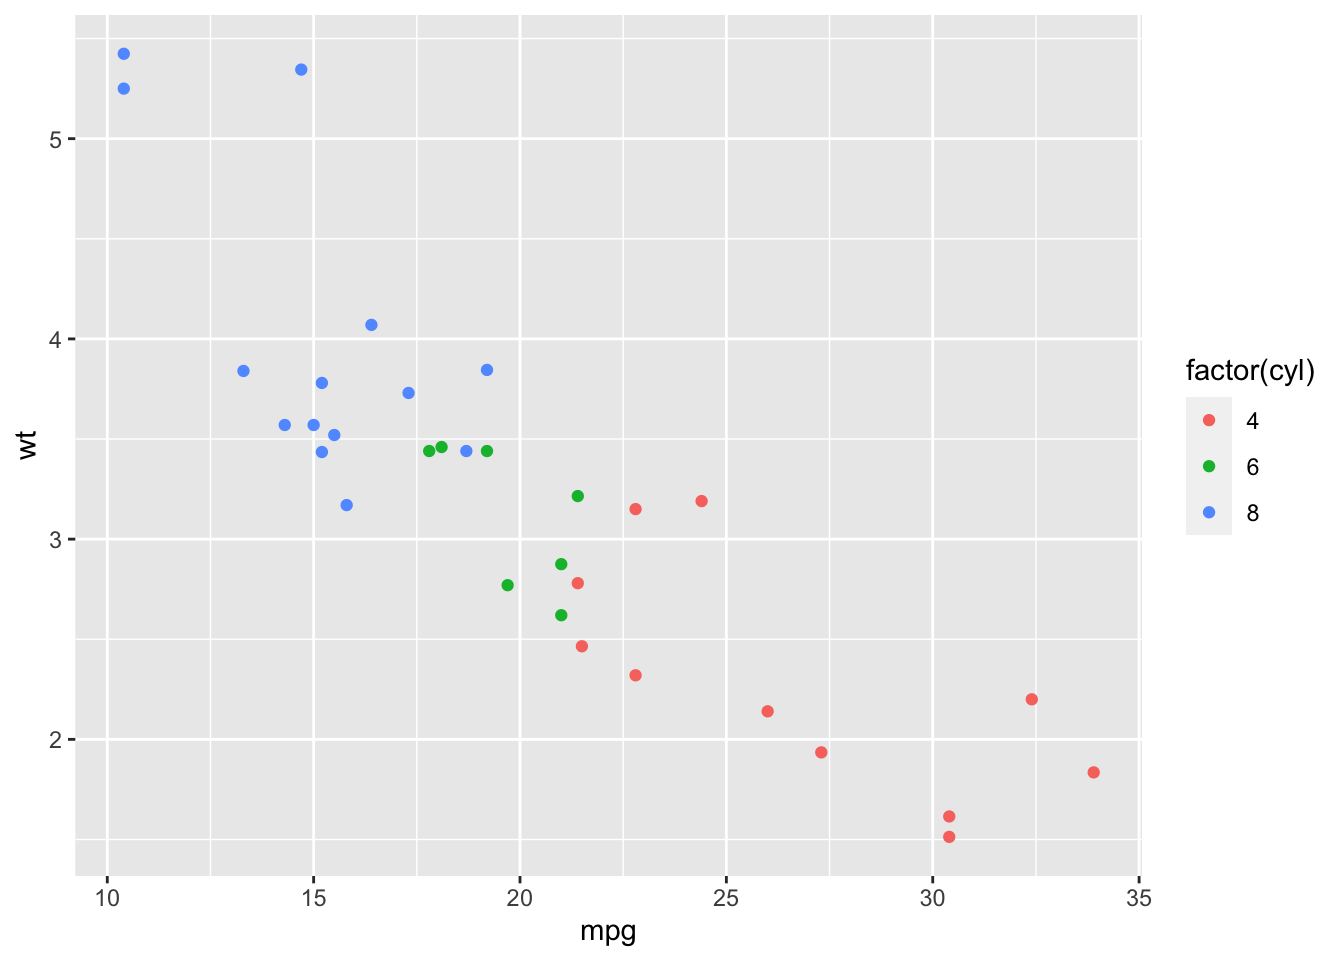
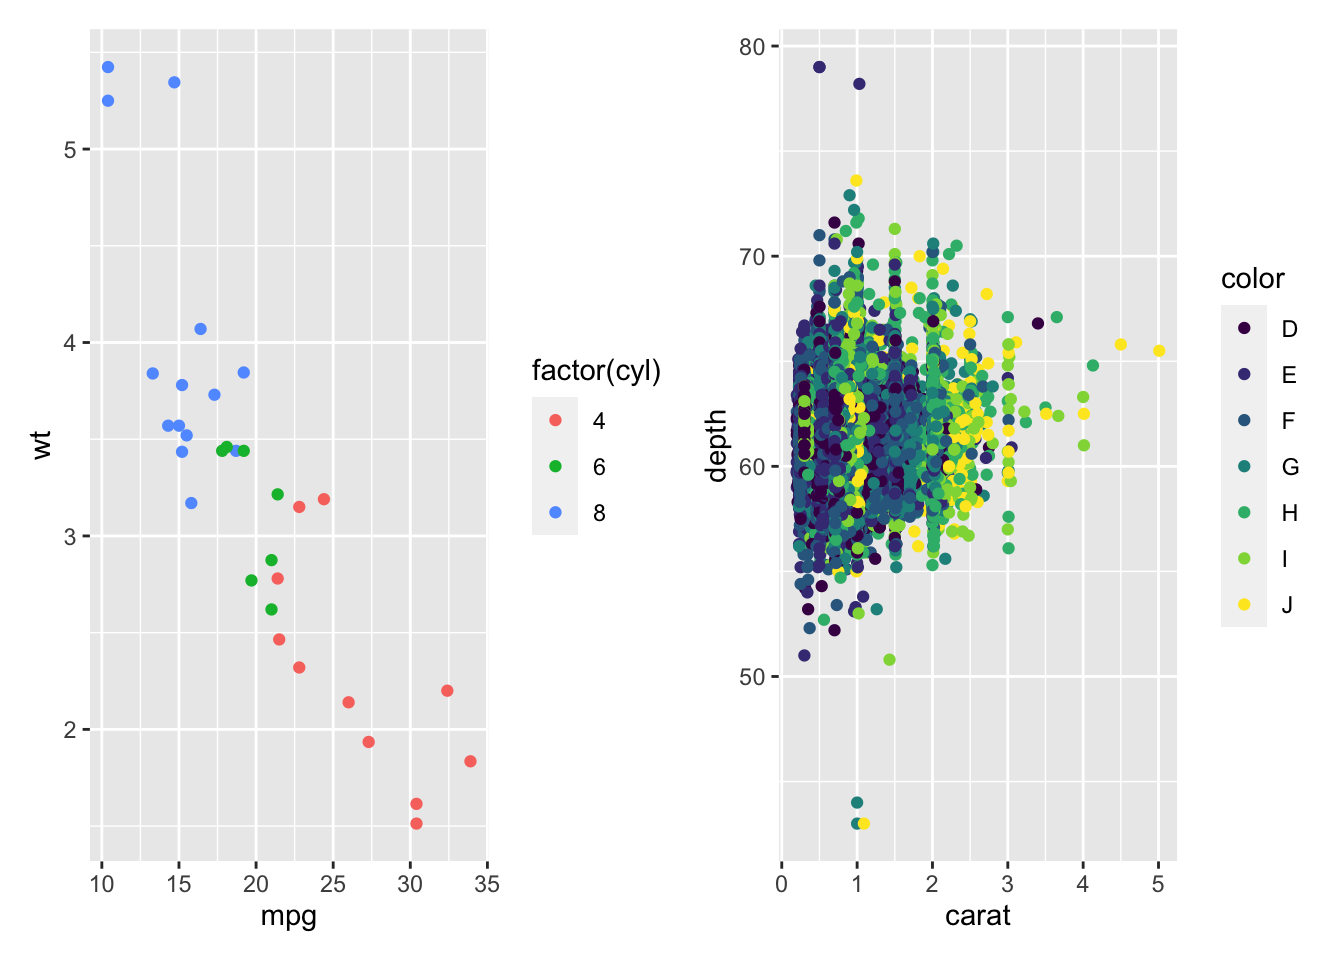
p1 <- ggplot(mtcars, aes(mpg, wt, colour = factor(cyl))) + geom_point()
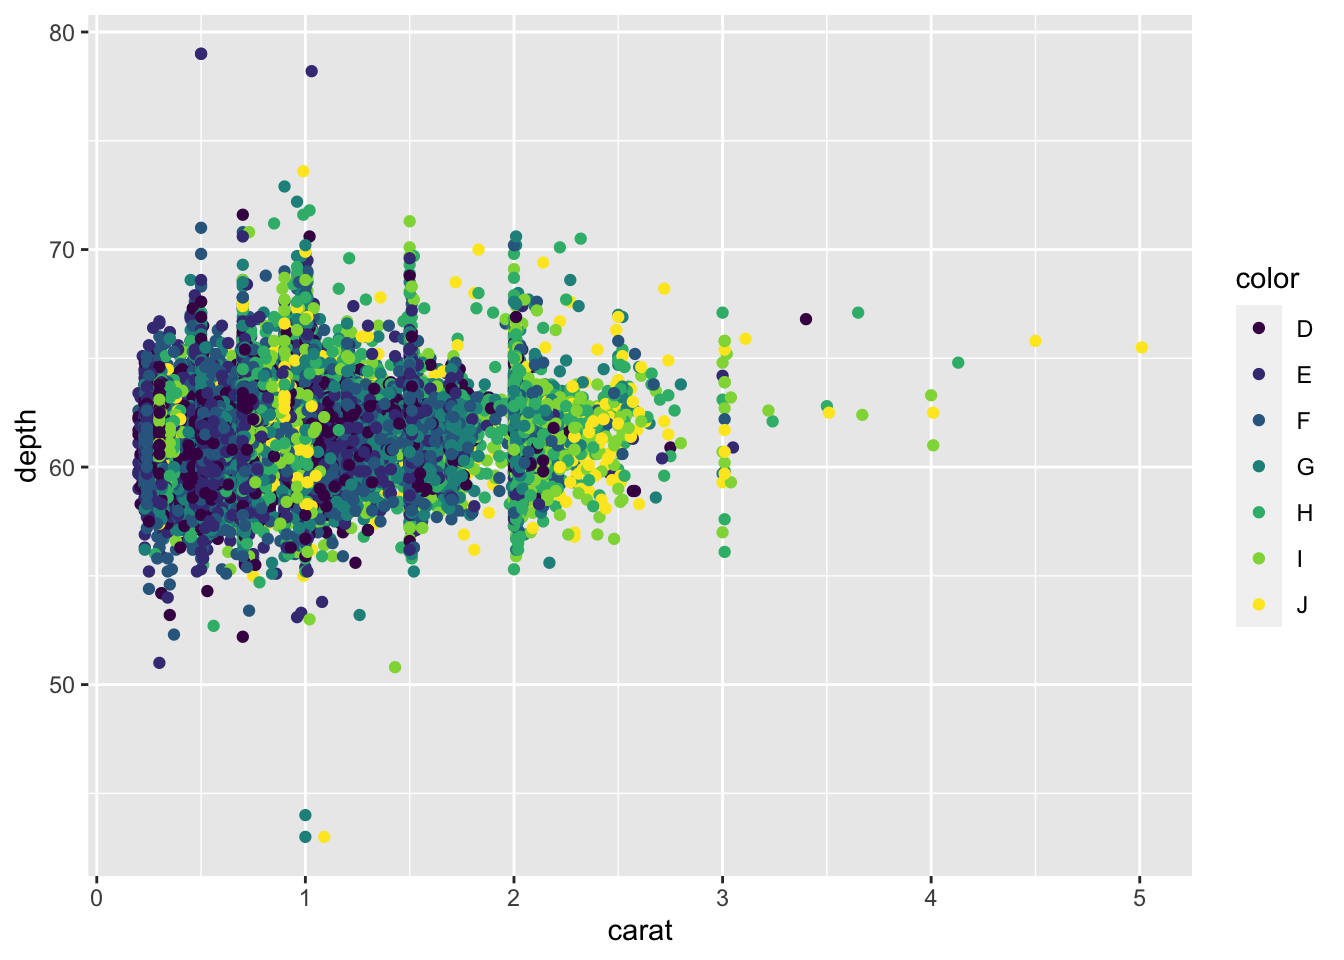
p2 <- ggplot(diamonds, aes(carat, depth, colour = color)) + geom_point()
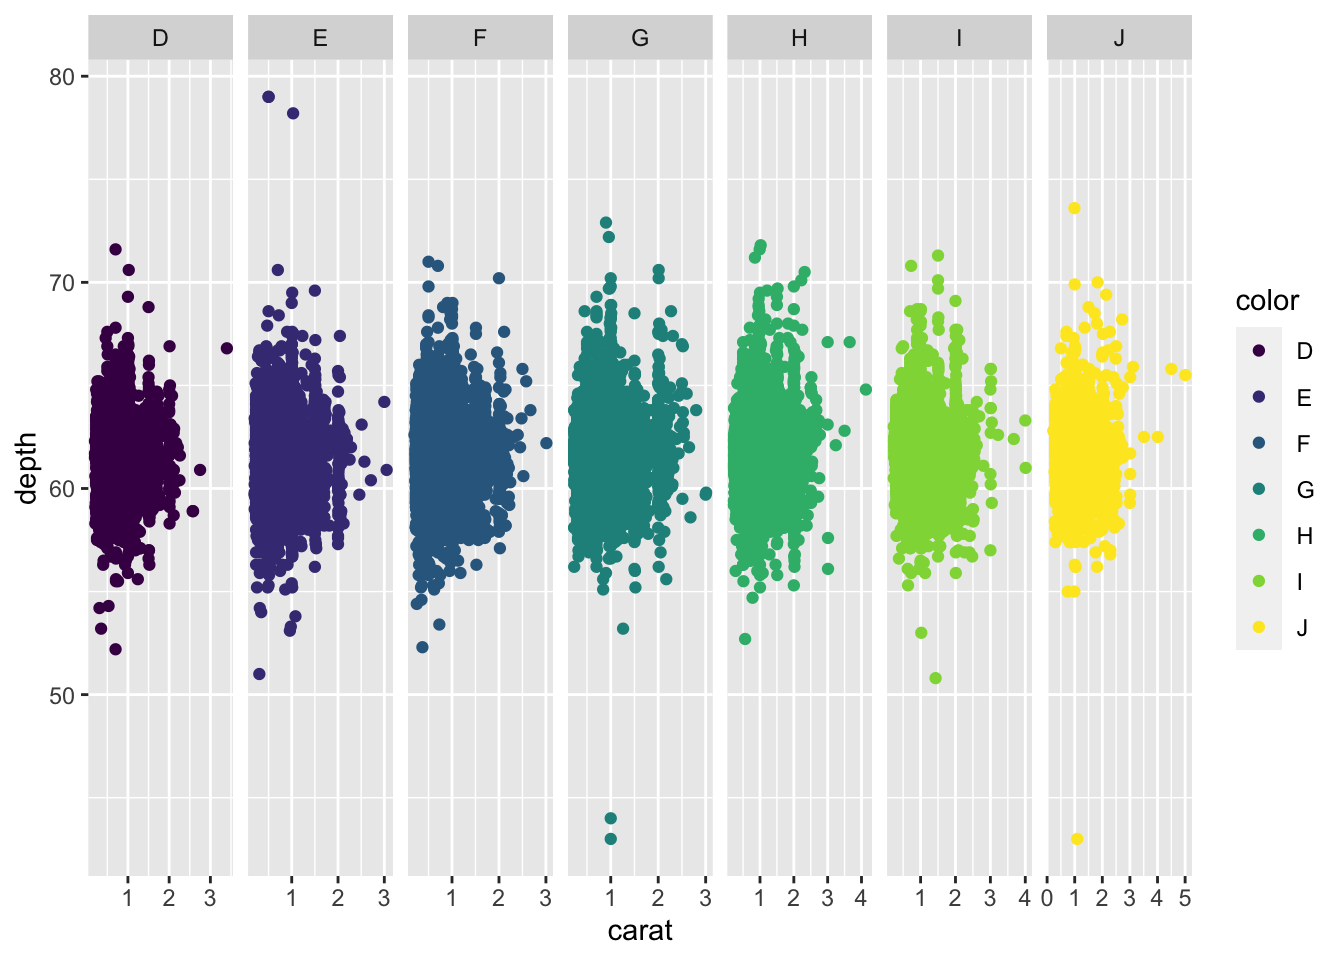
p3 <- ggplot(diamonds, aes(carat, depth, colour = color)) + geom_point() + facet_grid(.~color,scale = "free")
p1
p2
p3
```
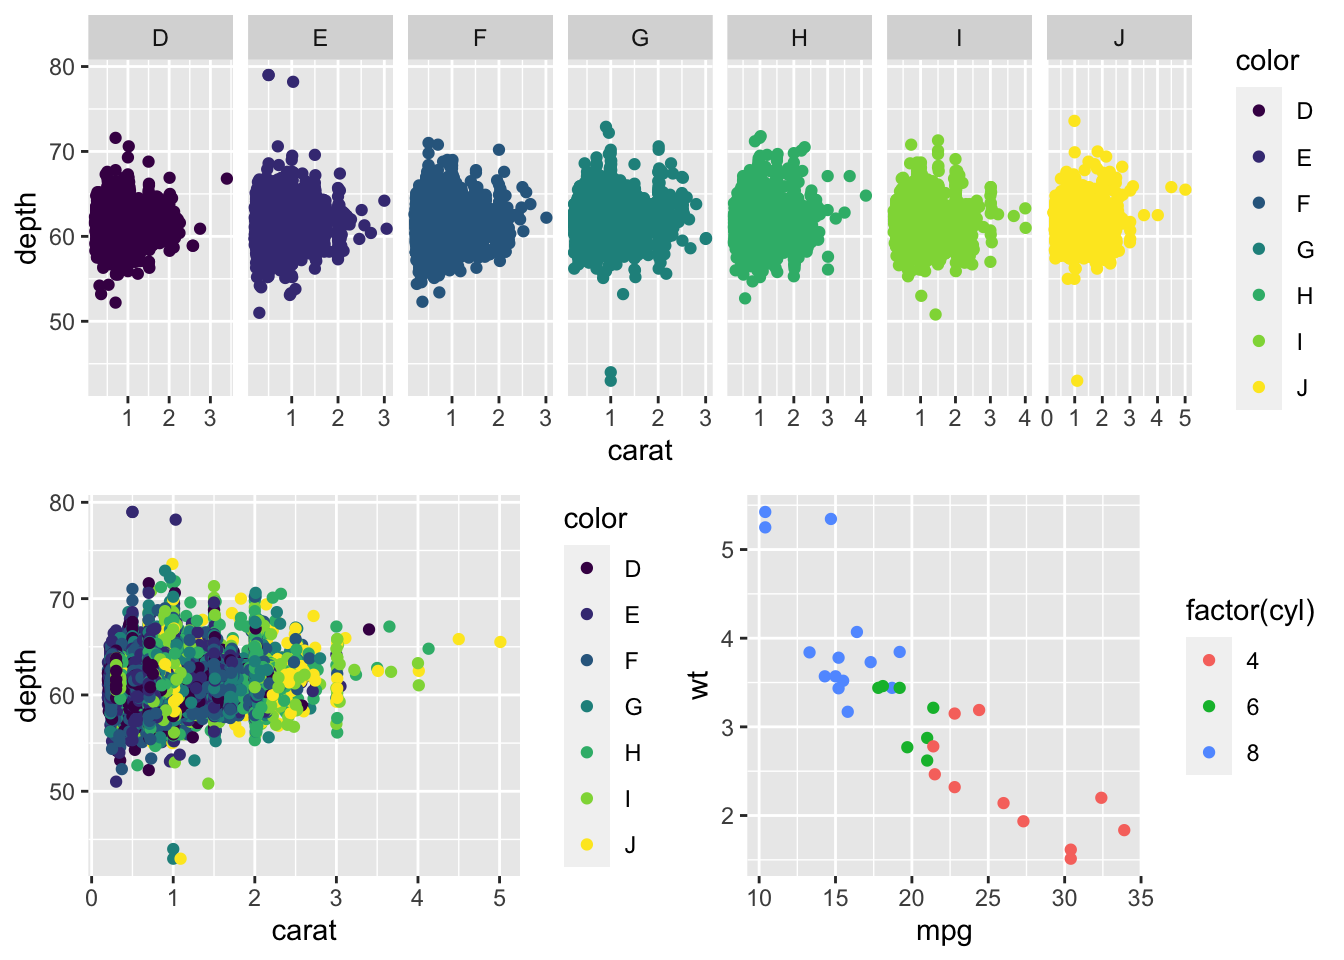
这里有三张图`p1,p1,p3`,我想把它输出到一个页面上,不单独输出,可以用一些方法
## 方法一: 使用grid包
```{r}
########新建画图页面###########
grid.newpage()  ##新建页面
pushViewport(viewport(layout = grid.layout(2,2))) ####将页面分成2*2矩阵
vplayout <- function(x,y){
  viewport(layout.pos.row = x, layout.pos.col = y)
}
print(p3, vp = vplayout(1,1:2))   ###将(1,1)和(1,2)的位置画图p3
print(p2, vp = vplayout(2,1))   ###将(2,1)的位置画图p2
print(p1, vp = vplayout(2,2))  ###将(2,2)的位置画图p1
#dev.off() ##画下一幅图,记得关闭窗口
```
## 方法二: 使用patchwork包
这个包需要从github上安装
```
devtools::install_github("thomasp85/patchwork")
```
```{r}
library(ggplot2)
library(patchwork)
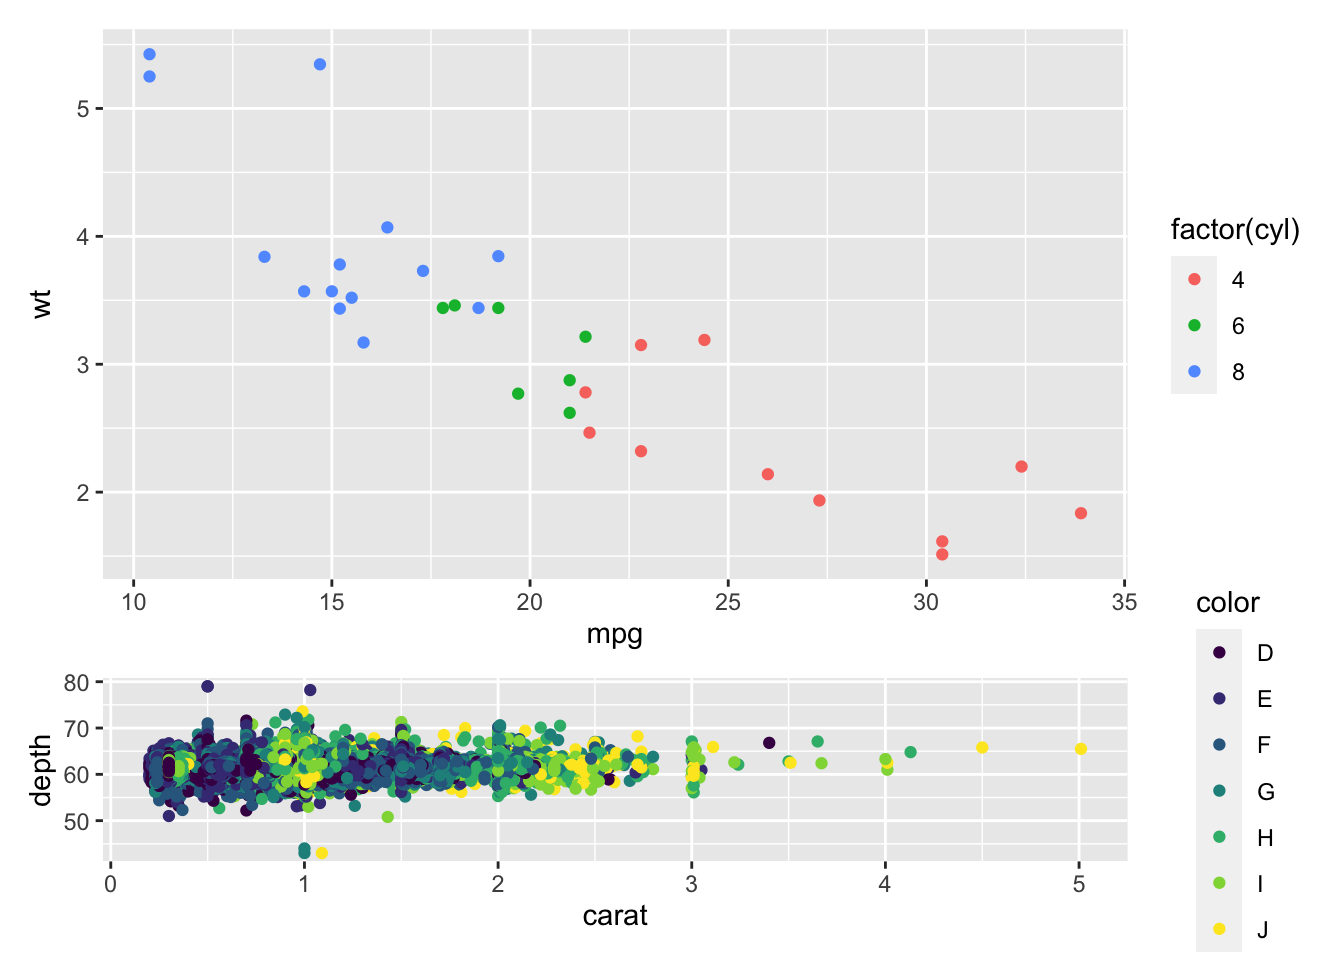
p1 <- ggplot(mtcars, aes(mpg, wt, colour = factor(cyl))) + geom_point()
p2 <- ggplot(diamonds, aes(carat, depth, colour = color)) + geom_point()
p1 + p2 #把图p1 ,p2画在一页上
```
```{r}
# 可以直接进行拼凑
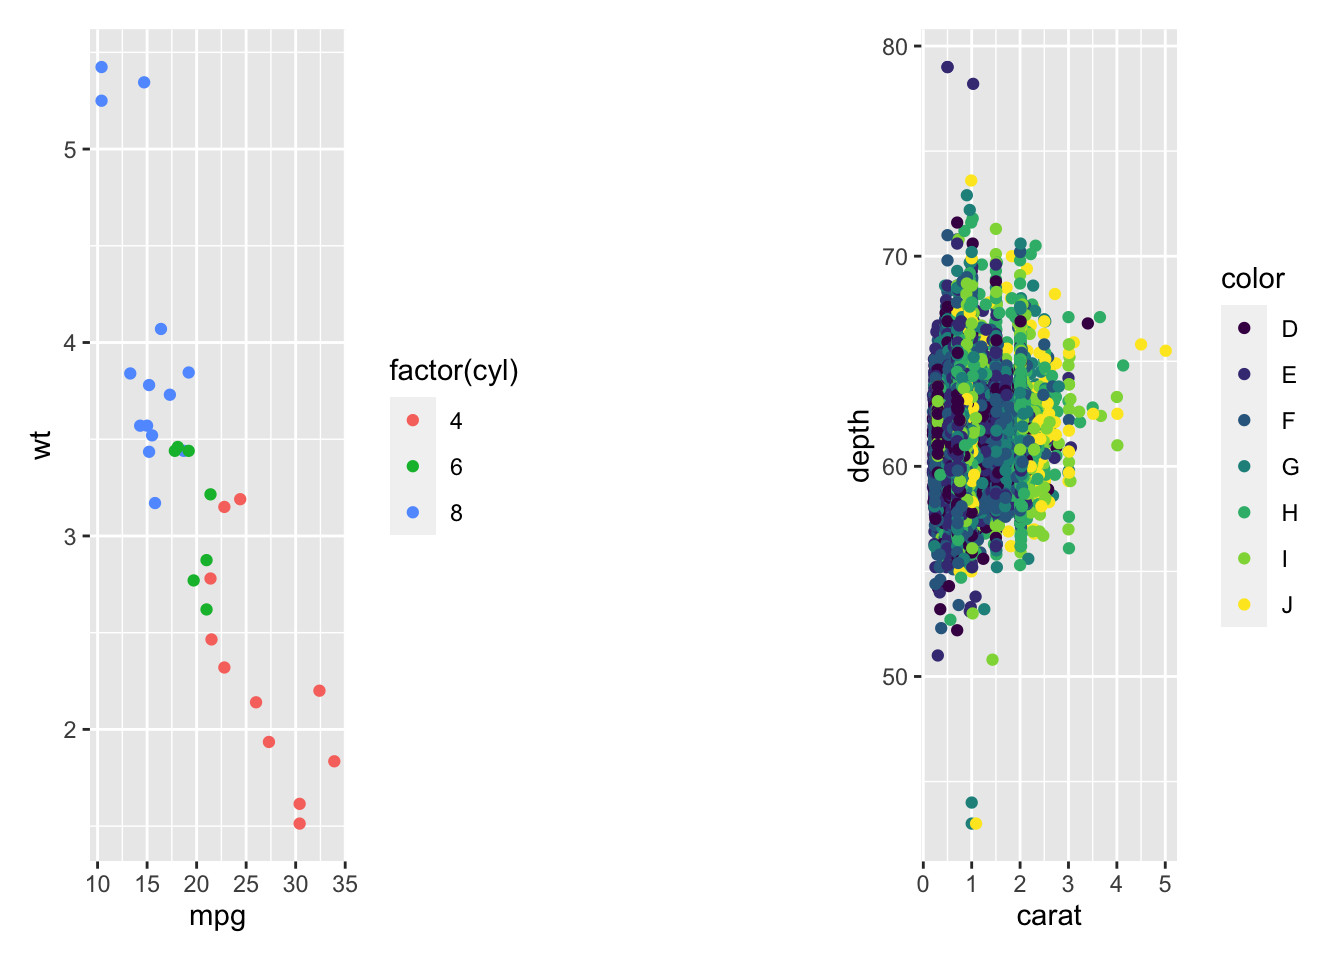
ggplot(mtcars, aes(mpg, wt, colour = factor(cyl))) + geom_point() +
ggplot(diamonds, aes(carat, depth, colour = color)) + geom_point()# 默认的页面布局是1行多列
```
### 使用`plot_layout()`函数调整页面布局
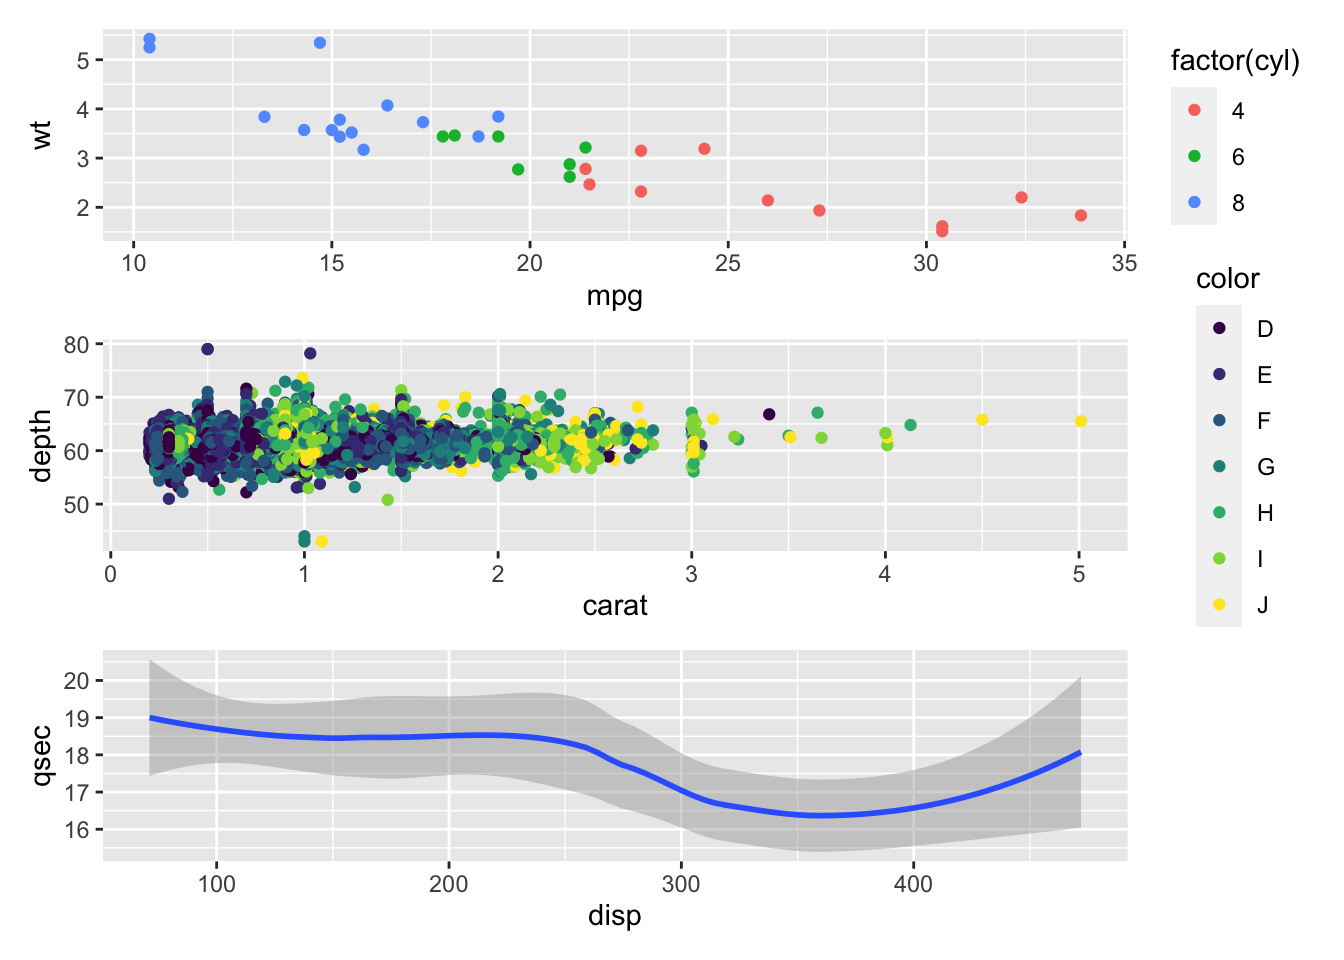
```{r}
p1 + p2 + plot_layout(ncol = 1, heights = c(3, 1))
```
### 图表之间添加或删除空格--`plot_spacer()`
```{r}
p1 + plot_spacer() + p2
```
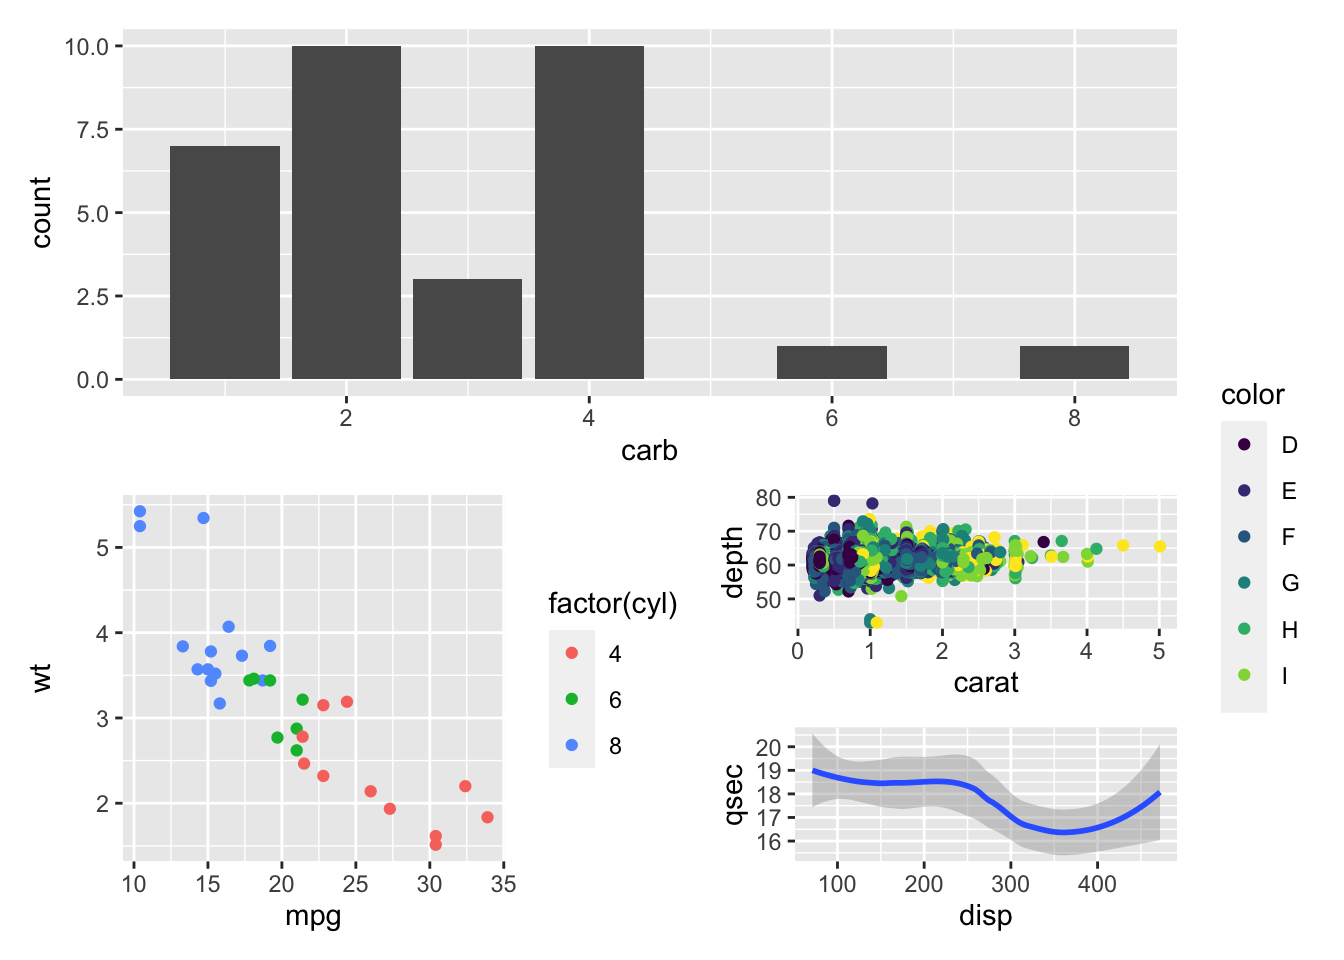
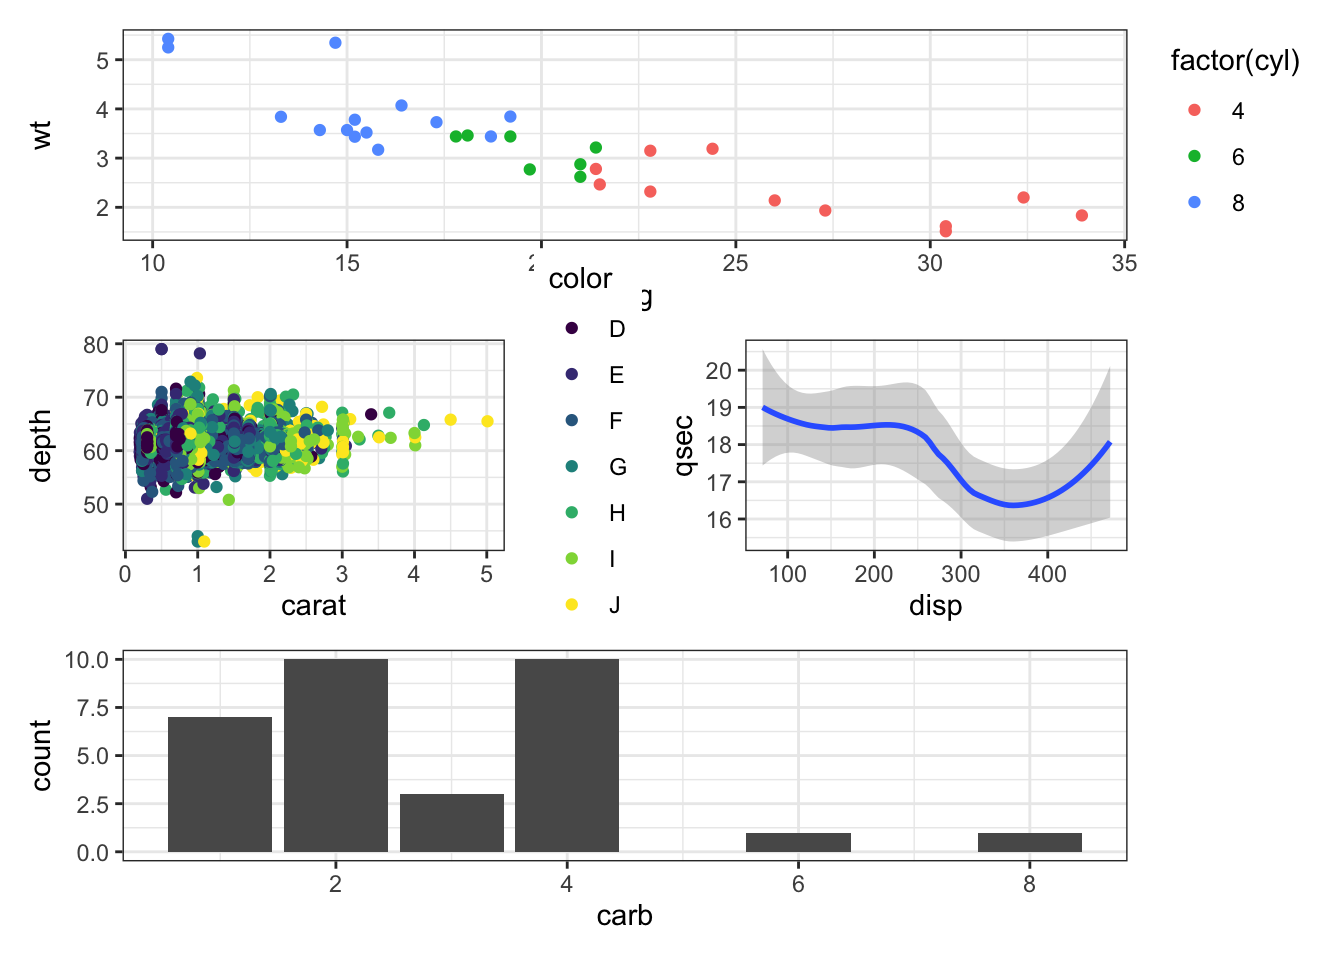
拼凑提供的一个非常有用的功能是它使用户能够创建“子图”
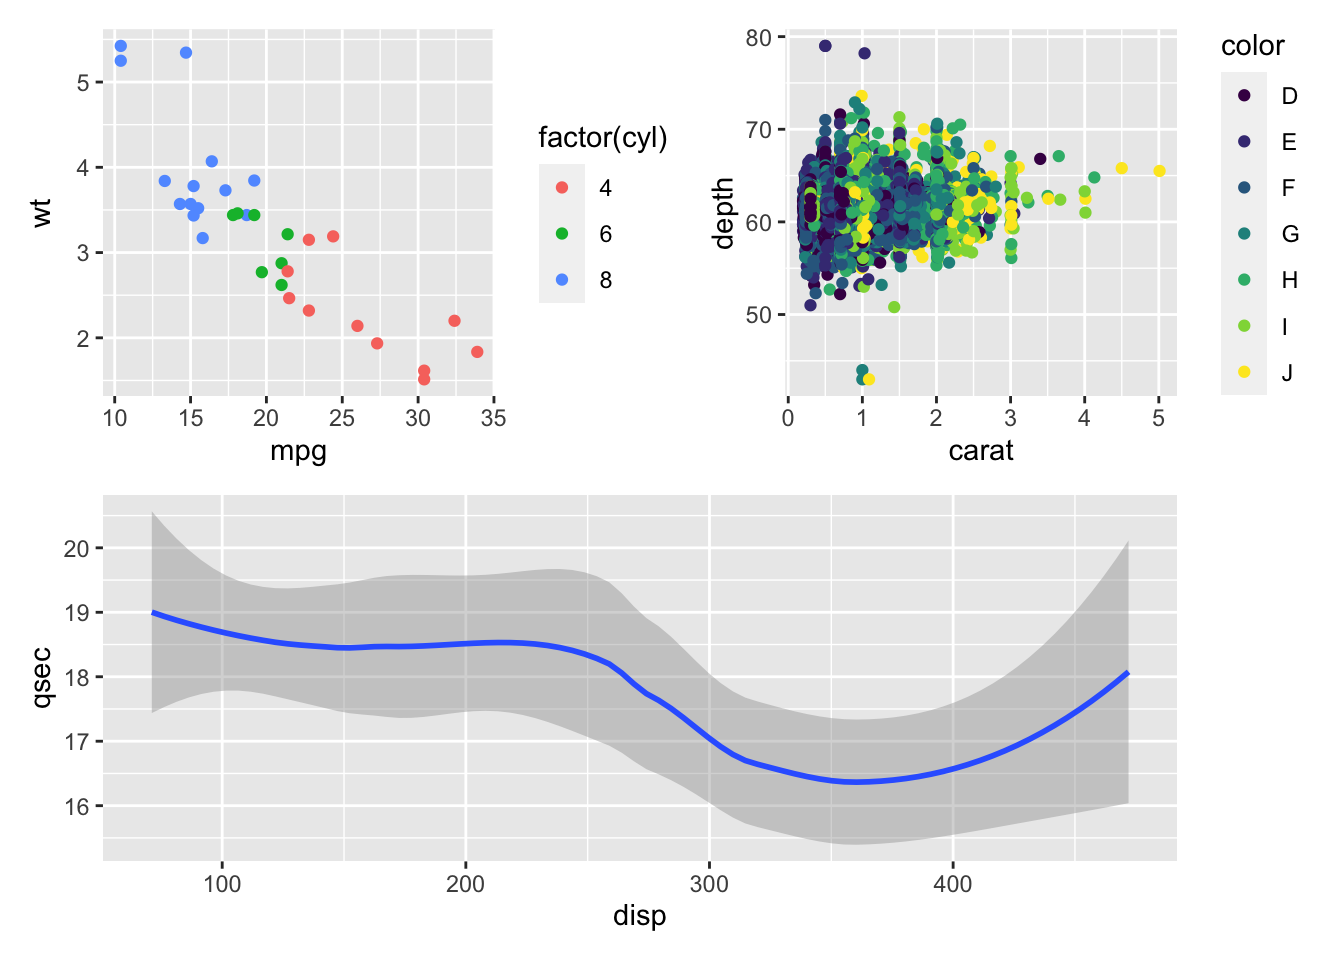
```{r}
p3 <- ggplot(mtcars) + geom_smooth(aes(disp, qsec), method = 'loess',formula= y ~ x)
p4 <- ggplot(mtcars) + geom_bar(aes(carb))

p4 + {
    p1 + {
        p2 +p3 +plot_layout(ncol = 1)
      }
  } +plot_layout(ncol = 1)
```
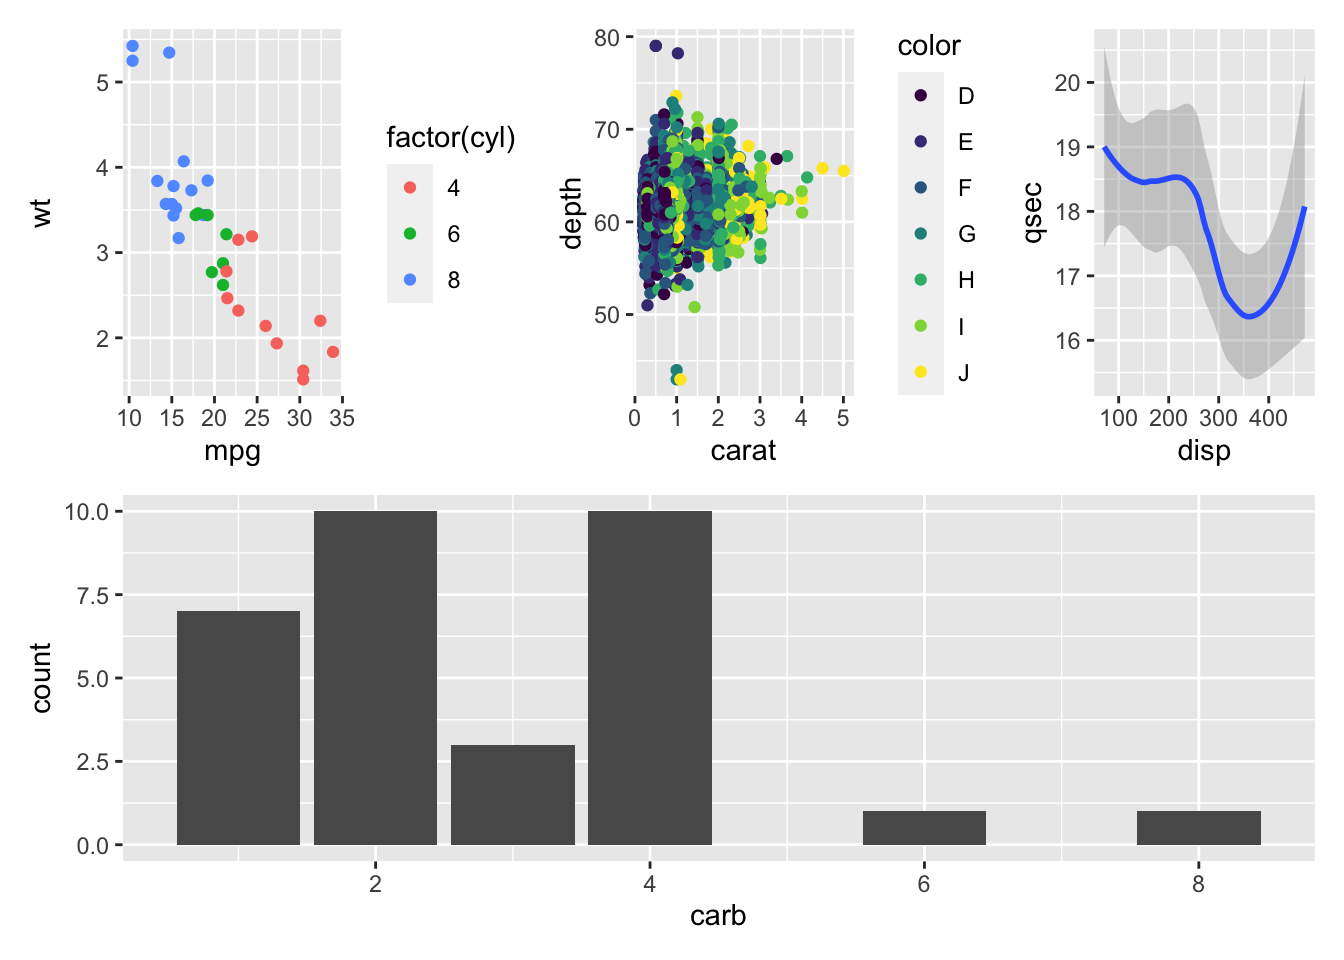
### 高级功能
拼凑的有趣之处在于您可以使用`+`,`-`运算符来定义嵌套级别:
```{r}
p1 + p2 + p3 + plot_layout(ncol = 1)
# 看看下面的代码并注意到现在p1和p2是“嵌套的”:
p1 + p2 - p3 + plot_layout(ncol = 1)
## 接下来两个操作是|和/分别用于水平和垂直布局。您可以在同一操作中使用它们
(p1 | p2 | p3) /p4
```
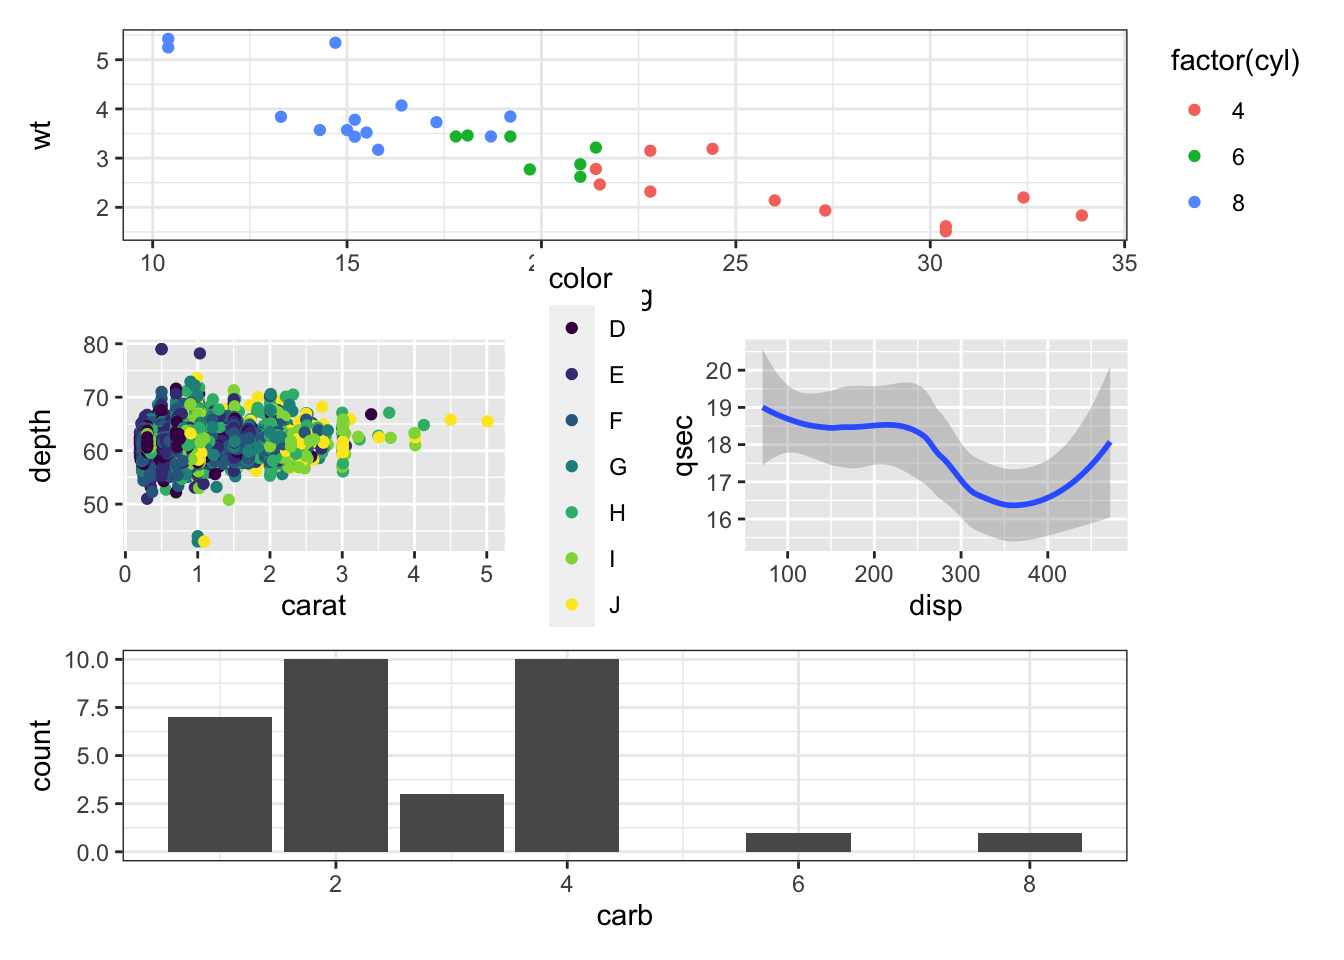
最后,您可以使用`&`或`*`而不必为每个单独的绘图设置布局设置。这是非常有用的功能,特别是如果您需要将多个图组合在一起。 `*`修改当前嵌套级别的图:
```{r}
(p1 + (p2 + p3) + p4 + plot_layout(ncol = 1)) * theme_bw() # * 只会影响当前嵌套级别的图
p1 + (p2 + p3) + p4 + plot_layout(ncol = 1) & theme_bw() # & 将递归到嵌套级别
```
```{r}
sessionInfo()
```