作者

zsc

发布日期

2019年4月1日

使用plotrix包

Show the code
#png("2y_1.png")
rm(list = ls())
library(plotrix)
library(dplyr)

Attaching package: 'dplyr'
The following objects are masked from 'package:stats':

    filter, lag
The following objects are masked from 'package:base':

    intersect, setdiff, setequal, union
Show the code
new_iris = arrange(iris,Sepal.Length)# 按照花瓣的长度进行排序 --- 为了后面好看  
head(new_iris,10)
   Sepal.Length Sepal.Width Petal.Length Petal.Width Species
1           4.3         3.0          1.1         0.1  setosa
2           4.4         2.9          1.4         0.2  setosa
3           4.4         3.0          1.3         0.2  setosa
4           4.4         3.2          1.3         0.2  setosa
5           4.5         2.3          1.3         0.3  setosa
6           4.6         3.1          1.5         0.2  setosa
7           4.6         3.4          1.4         0.3  setosa
8           4.6         3.6          1.0         0.2  setosa
9           4.6         3.2          1.4         0.2  setosa
10          4.7         3.2          1.3         0.2  setosa
Show the code
# 设置数据 -
y1 = new_iris$Sepal.Length[1:10]
x1_axis = 1:length(y1)

y2 = new_iris$Petal.Length[1:10]
x2_axis = 1:length(y2)


par(family='STKaiti')
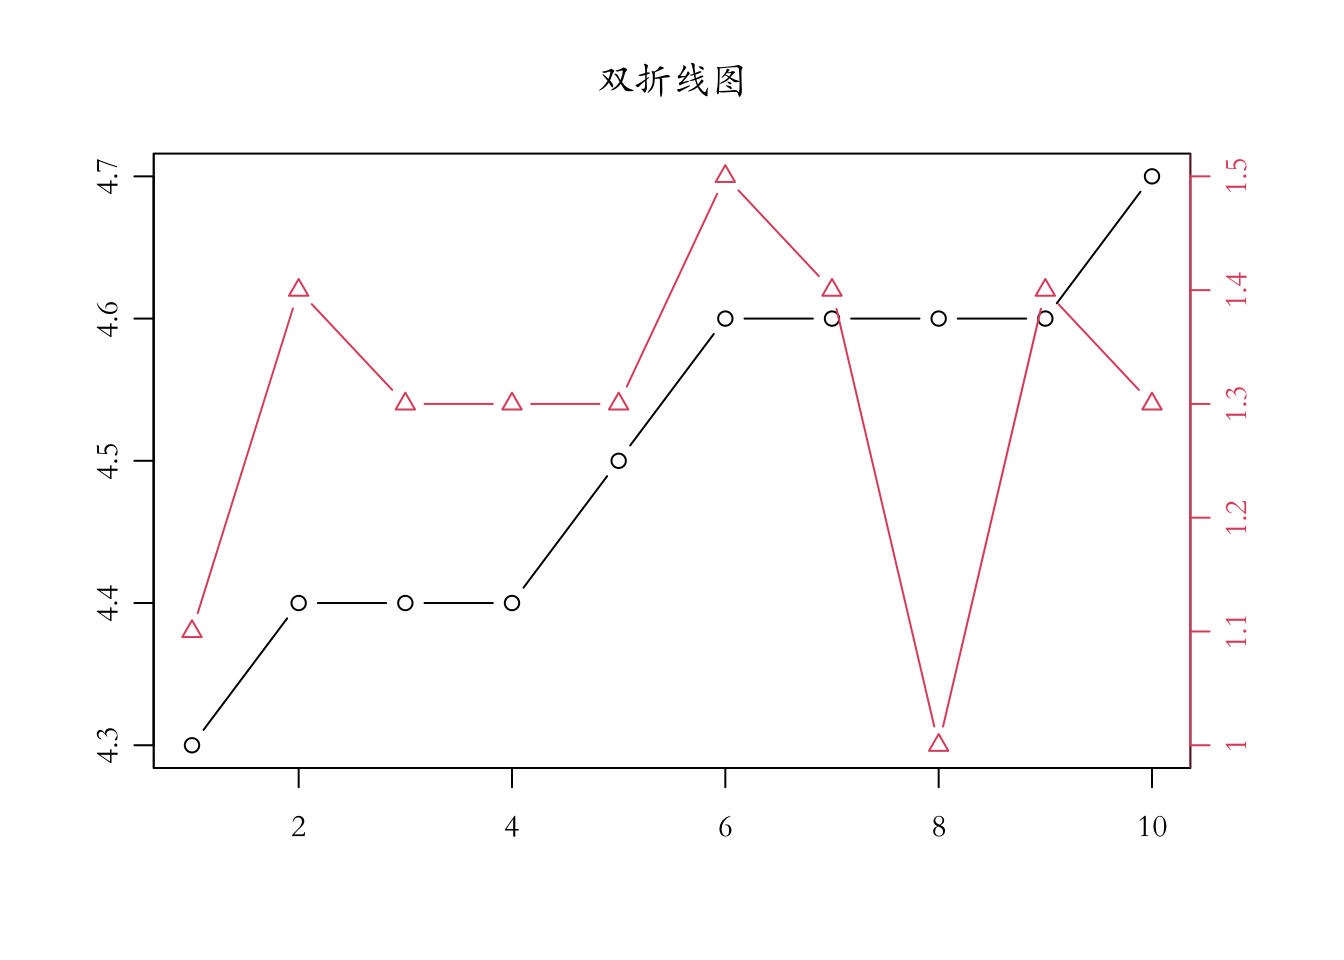
twoord.plot(x1_axis, y1, x2_axis, y2,main = '双折线图') #  这线图

Show the code
par(family='STKaiti')
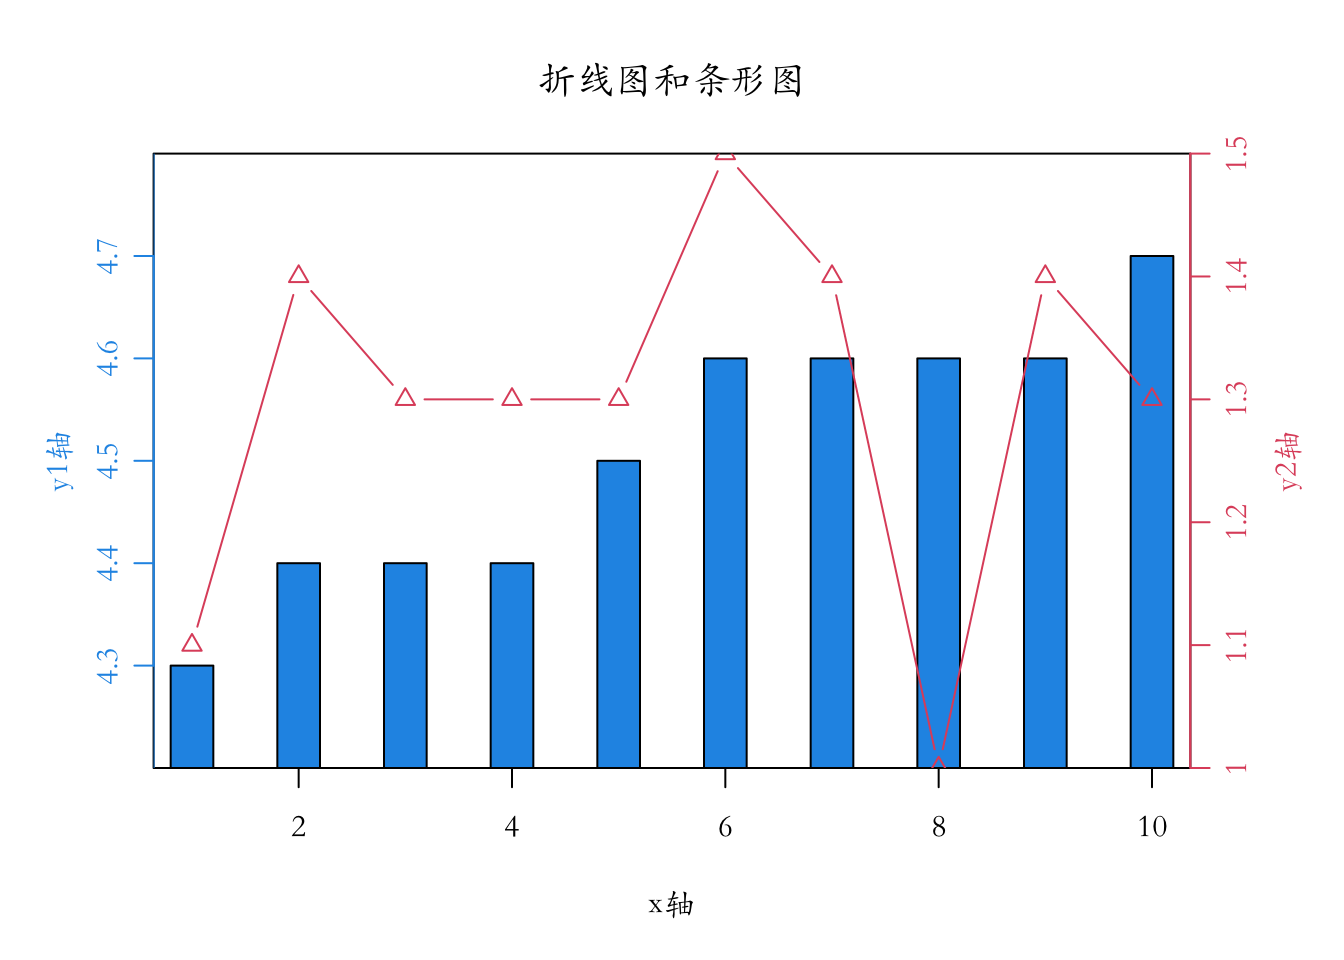
twoord.plot(x1_axis, y1, x2_axis, y2,lylim=c(4.2,4.8),rylim=c(1,1.5),lcol=4,rcol=2,main = '折线图和条形图',
            xlab="x轴",ylab="y1轴",rylab="y2轴",type=c("bar","b"),halfwidth=0.2) # 折线图和条形图

Show the code
#dev.off()

twoord.plot() 参数解释

twoord.plot()函数语法及参数含义:

 twoord.plot(lx,ly,rx,ry,data=NULL,main="",xlim=NULL,lylim=NULL,rylim=NULL,
        mar=c(5,4,4,4),lcol=1,rcol=2,xlab="",lytickpos=NA,ylab="",ylab.at=NA,
        rytickpos=NA,rylab="",rylab.at=NA,lpch=1,rpch=2,
        type="b",xtickpos=NULL,xticklab=NULL,halfwidth=0.4,axislab.cex=1,do.first=NULL,...)
  • lx,ly,rx,ry:分别指定左坐标轴和右坐标轴的值,必须是连续的值
  • data:需要绘制双轴图形的数据框
  • main:为图形指定标题
  • xlim:限制横坐标值的范围
  • lylim,rylim:限制左右纵坐标值的范围
  • mar:设置图形边界距,默认值为(5,4,4,4)
  • lcol,rcol:设置左右坐标轴的颜色,这样可以起到图例的作用
  • xlab:设置横坐标轴标签
  • lytickpos:设置左坐标轴刻度标签的位置
  • ylab:设置左坐标轴标签
  • ylab.at:设置左坐标轴标签位置
  • rytickpos:设置右坐标轴刻度标签的位置
  • rylab:设置又坐标轴标签
  • rylab.at:设置右坐标轴标签位置
  • lpch,rpch:设置左右坐标轴图形的外观
  • type:指定图形类型,参考plot参数的类型
    • p 为 points,I for lines, b for both,“c” for the lines part alone of “b”,
    • “o” for both ‘overplotted’,“h” for ‘histogram’ like (or ‘high-density’) vertical lines,
    • “s” for stair steps, “S” for other steps, “n” for no plotting.
  • xtickpos:设置横坐标轴刻度标签位置
  • xticklab:设置横坐标轴刻度标签
  • halfwidth:设置用户给定条形图宽度的一半
  • axislab.cex:设置坐标轴标签和刻度标签的大小
  • do.first:通过该参数可以往图形中添加背景色或网格线
Show the code
R version 4.2.1 (2022-06-23)
Platform: aarch64-apple-darwin20 (64-bit)
Running under: macOS Monterey 12.5.1

Matrix products: default
BLAS:   /Library/Frameworks/R.framework/Versions/4.2-arm64/Resources/lib/libRblas.0.dylib
LAPACK: /Library/Frameworks/R.framework/Versions/4.2-arm64/Resources/lib/libRlapack.dylib

locale:
[1] en_US.UTF-8/en_US.UTF-8/en_US.UTF-8/C/en_US.UTF-8/en_US.UTF-8

attached base packages:
[1] stats     graphics  grDevices utils     datasets  methods   base     

other attached packages:
[1] dplyr_1.0.9   plotrix_3.8-2

loaded via a namespace (and not attached):
 [1] rstudioapi_0.14   knitr_1.40        magrittr_2.0.3    tidyselect_1.1.2 
 [5] R6_2.5.1          rlang_1.0.4       fastmap_1.1.0     fansi_1.0.3      
 [9] stringr_1.4.1     tools_4.2.1       xfun_0.32         utf8_1.2.2       
[13] DBI_1.1.3         cli_3.3.0         htmltools_0.5.3   assertthat_0.2.1 
[17] yaml_2.3.5        digest_0.6.29     tibble_3.1.8      lifecycle_1.0.1  
[21] purrr_0.3.4       htmlwidgets_1.5.4 vctrs_0.4.1       glue_1.6.2       
[25] evaluate_0.16     rmarkdown_2.16.1  stringi_1.7.8     compiler_4.2.1   
[29] pillar_1.8.1      generics_0.1.3    jsonlite_1.8.0    pkgconfig_2.0.3